Data Analytics Portal
Overview
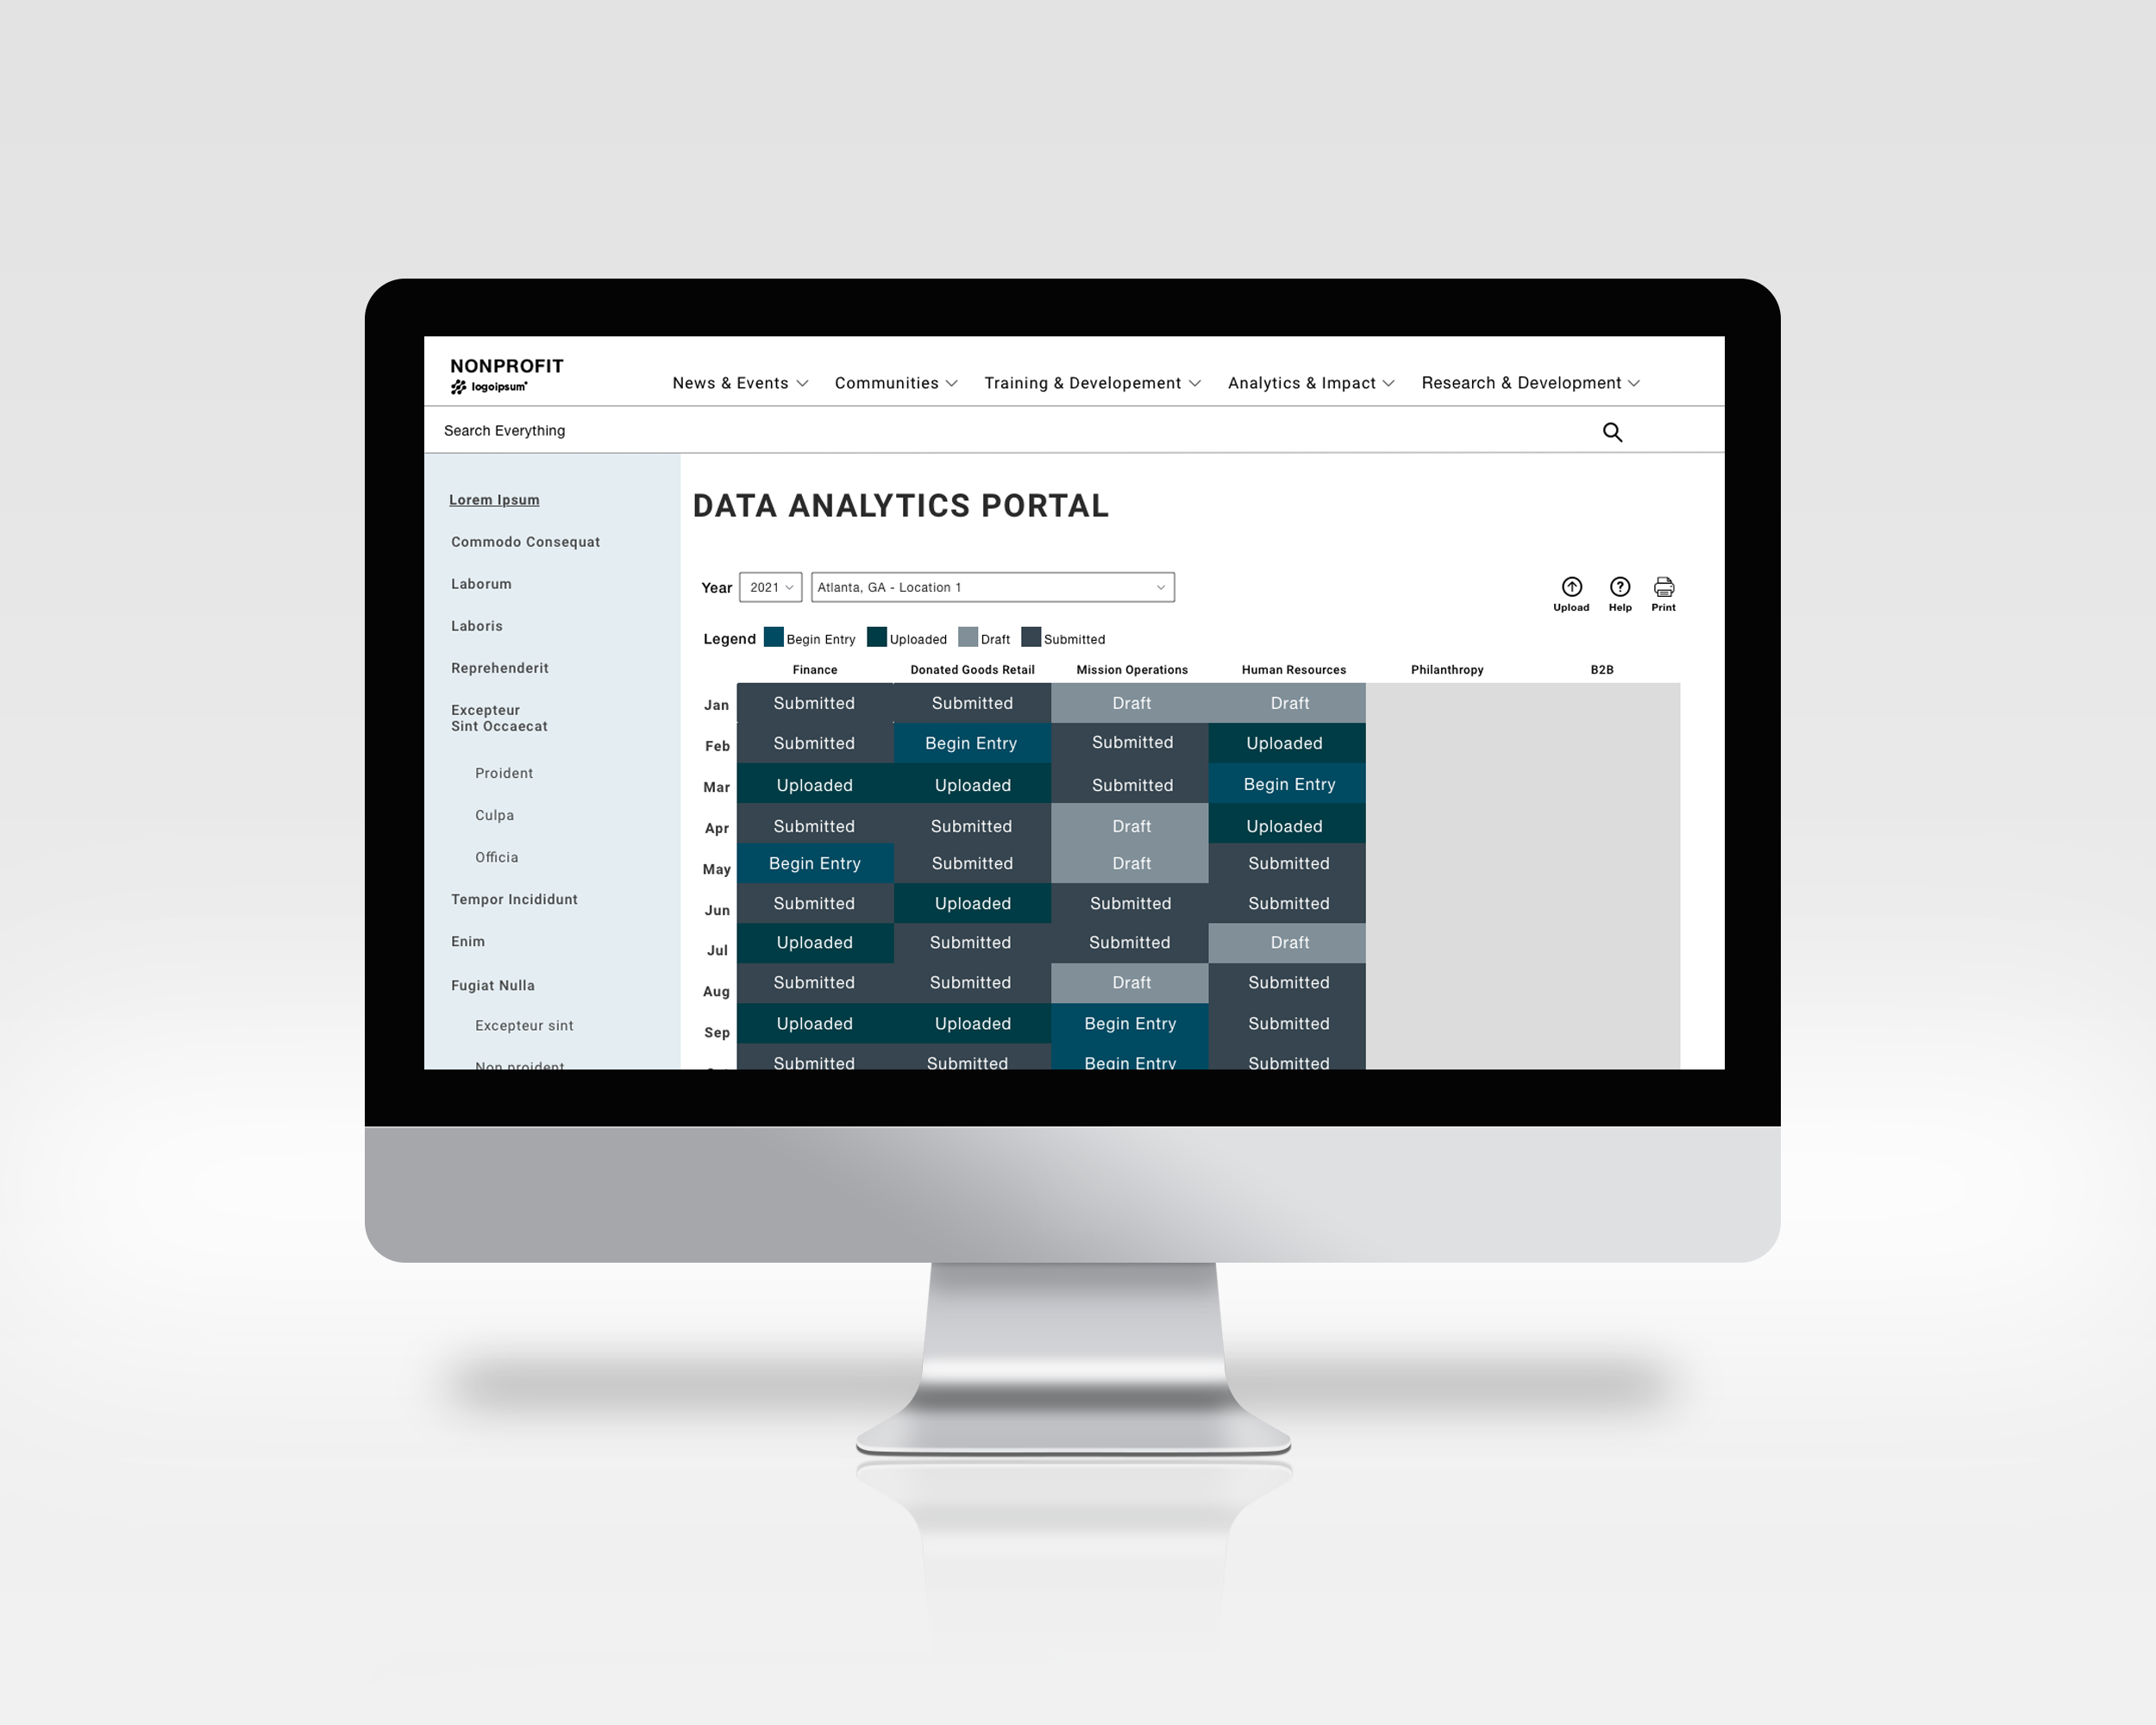
With this engagement, I served as the lead UX/UI Designer for a project transforming a major nonprofit’s member data analytics portal allowing clients to manage 400 data elements over six domains. As the UX/UI designer, I provided design solutions from initial sketches to a clickable prototype in InVision, which demonstrates how members upload, access, and update data entries from multiple data domains for both monthly and annual entry. Working in close collaboration with client-side data, development, and business leadership along with the internal consulting team, I was able to translate the business and technical requirements into a design solution that both the business and technical team agreed was more intuitive and easier to navigate for members.
Sketch
InVision
Process
discovery: At the onset of this project, I was tasked with the challenge to redesign a data analytics portal for a major nonprofit’s business customers. As a first step, I sought to understand the current users’ pain points by researching while I simultaneously carried out a heuristic evaluation to identify key design areas of improvement.
defining -> ideating: Once I had a basis for understanding key user functionality and pain points, I sketched out various ideas for reconfiguring the UX to better support users’ data entry and retrieval. I met with several client-side business stakeholders in ongoing meetings to receive feedback and iterate on initial sketches. As the initial sketches started shaping up into a high-level structure that the business stakeholders could agree upon, I moved into wireframing and continued to get feedback from the data analytics, business, and technical teams. Throughout the process I collaborated with the business analyst to ensure that all design requirements were documented and incorporated into ongoing updates.
prototype: Eventually, the user experience was solidified and I worked in conjunction with the team’s visual designer tasked with rebranding the client’s brand identity. Once the visual design guidelines and theme were established, I incorporated those guidelines into the prototype, which continued to be shared across multiple teams via InVision and was used as a key document for data analytics, business, and technical discussions.
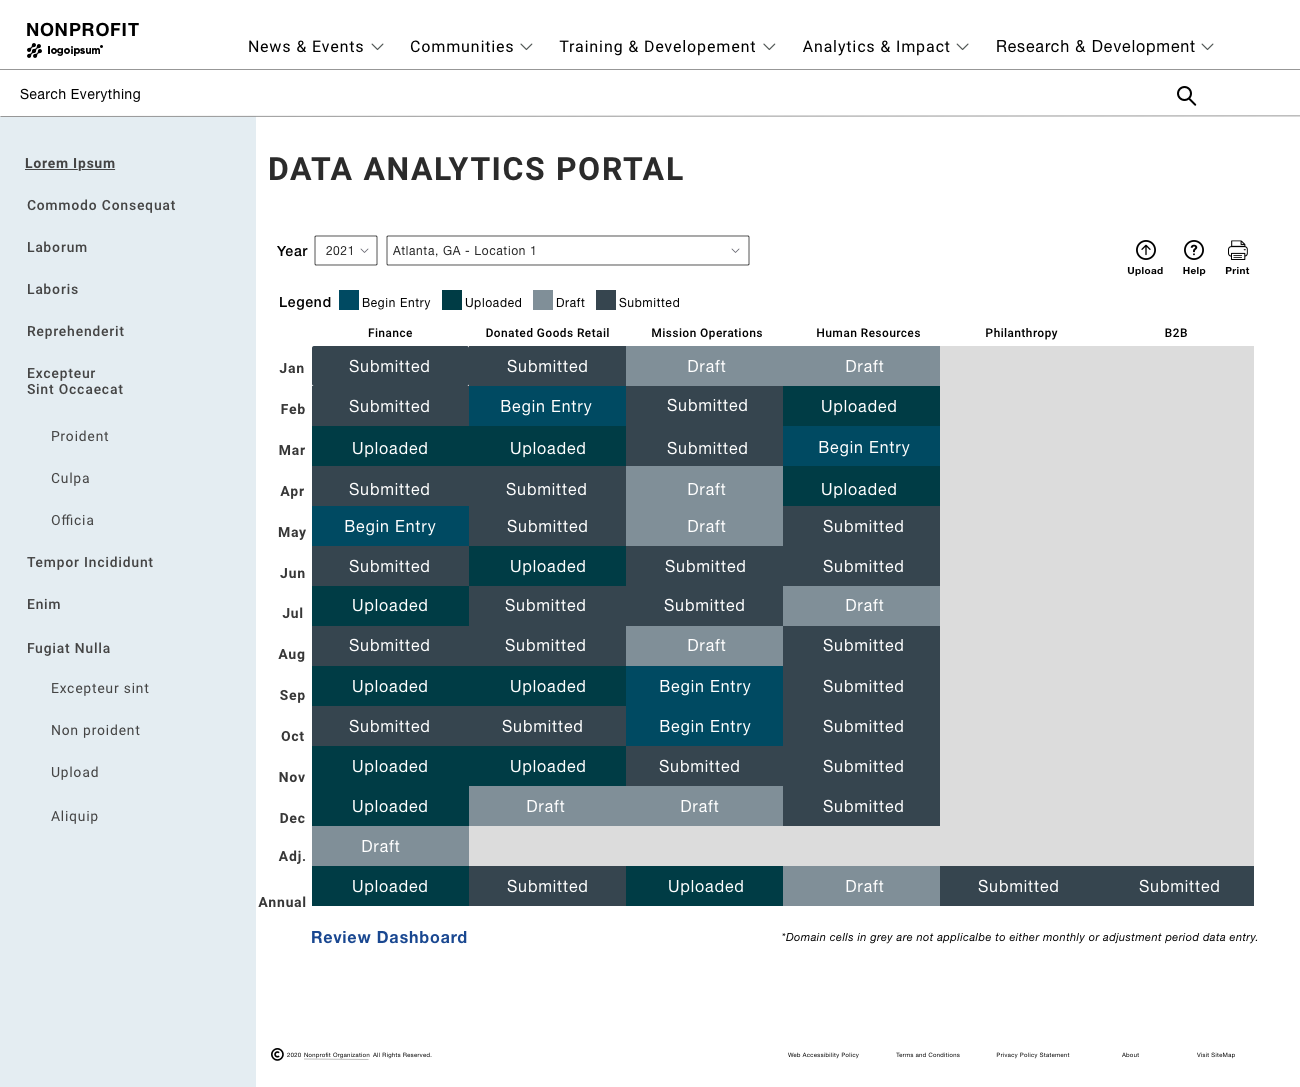
Member data analytics portal home
Finance data domain form
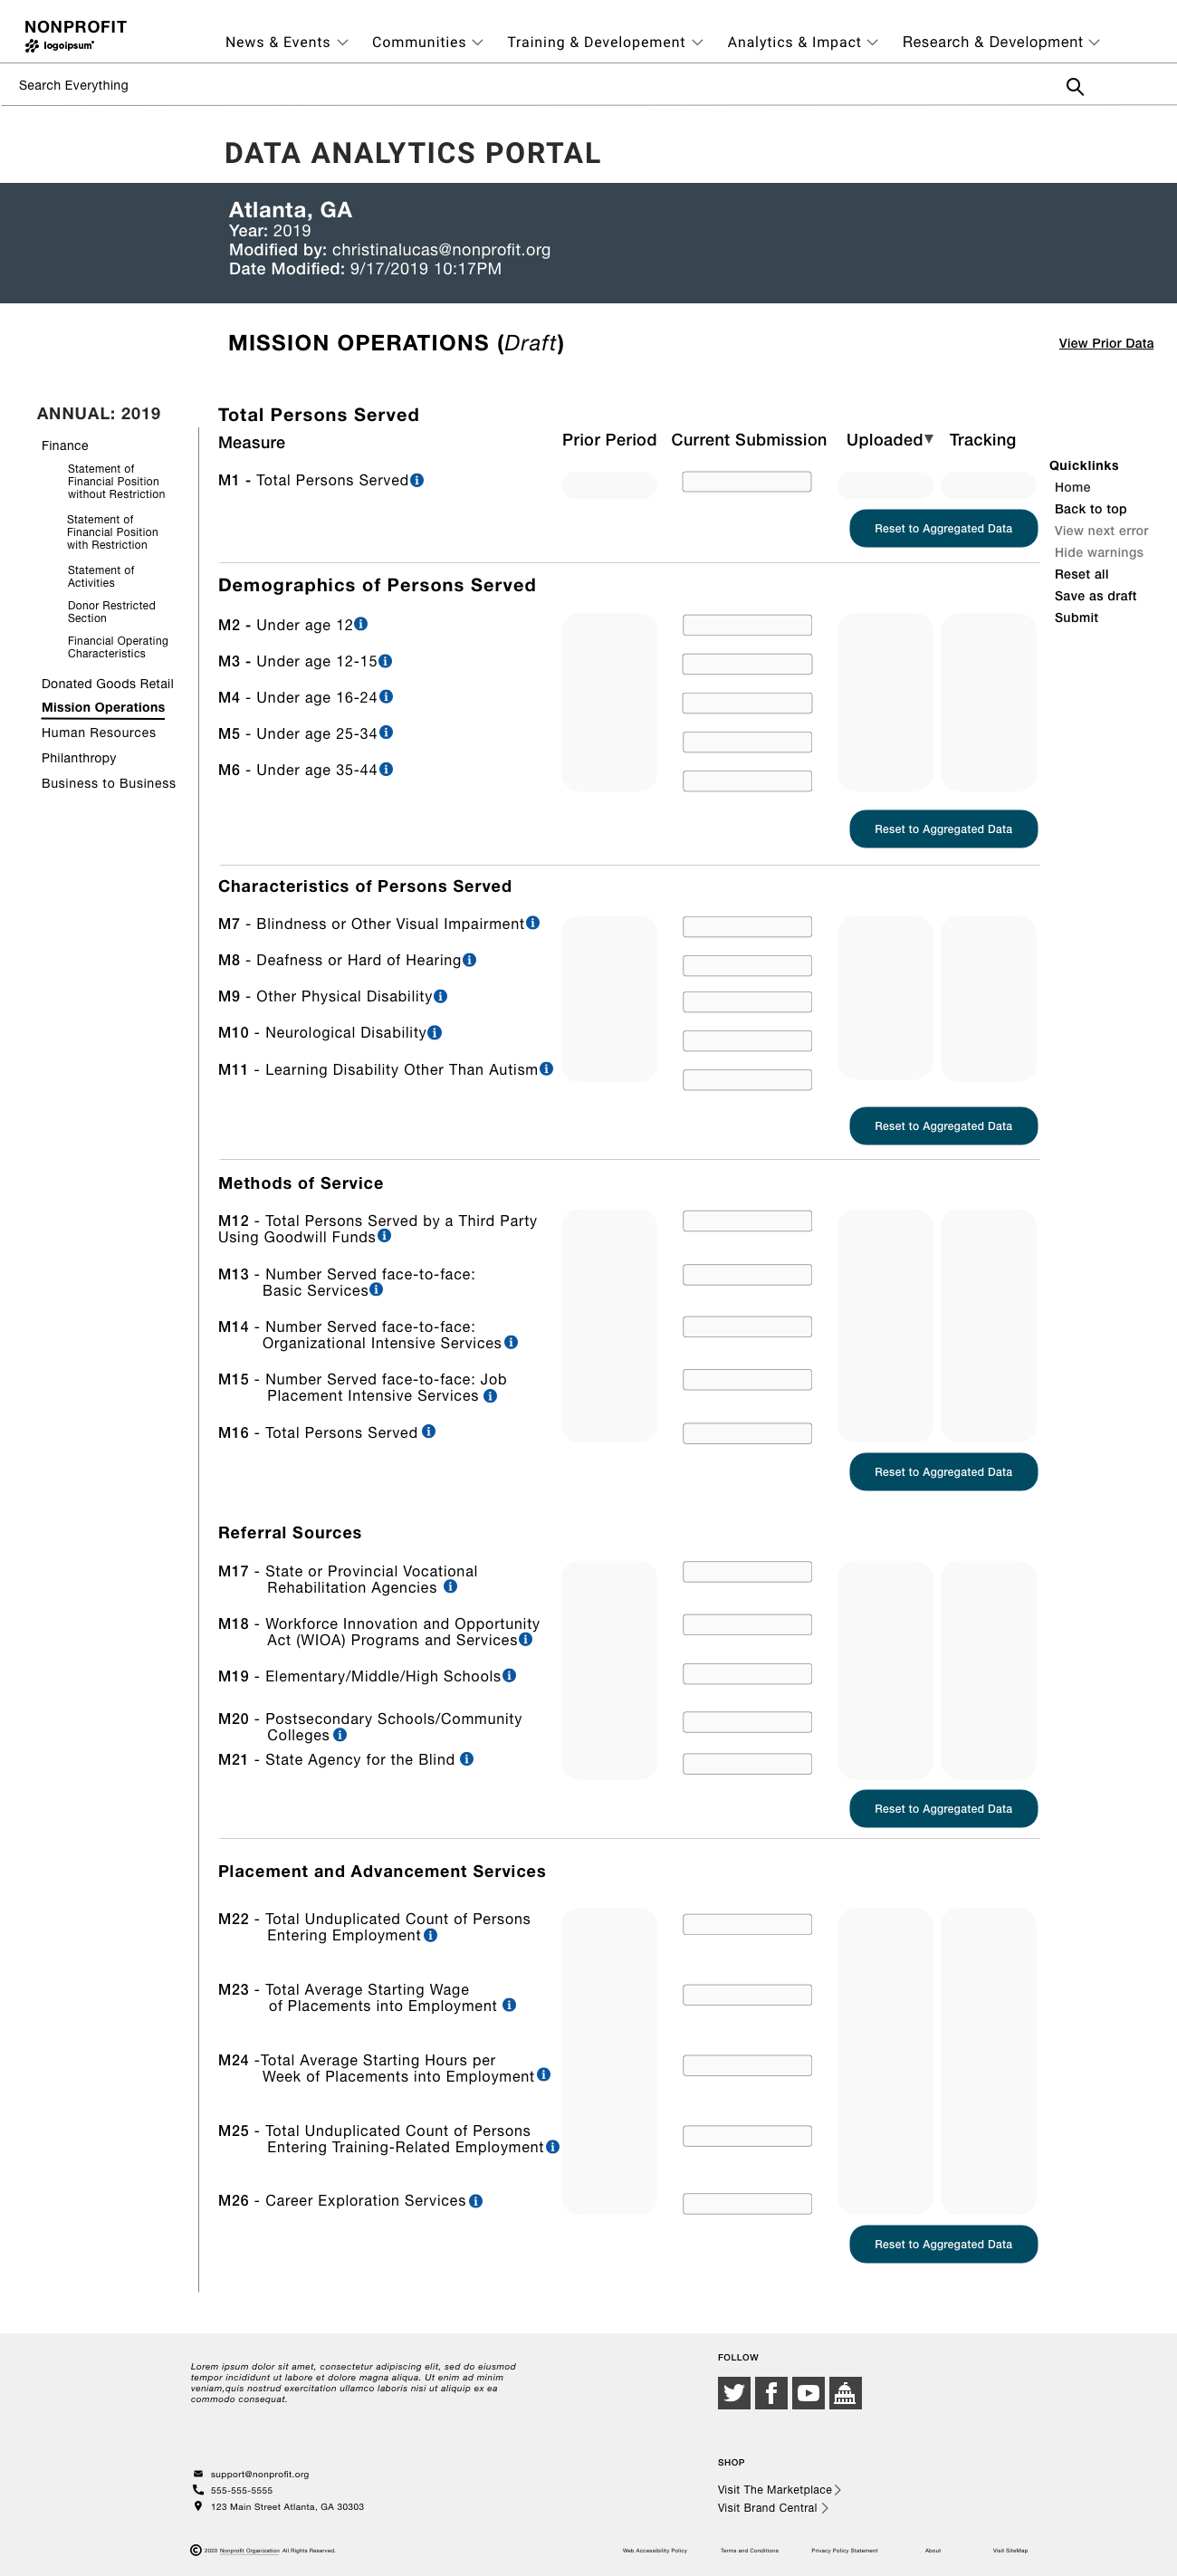
Mission operations data domain form
*The design shown here is a de-branded version.


